Import metrics from Grafana
Send a Prometheus panel's query to Observer as a new status-page metric.
The Observer Import plugin adds a panel-menu action to Grafana. With the plugin installed, any Prometheus panel in any dashboard gains a Create Observer metric from this query entry; clicking it opens the Observer console with the query and panel title pre-filled.
Scope:
- Prometheus panels only. Panels backed by other data sources do not show the action.
- One query per click. The action reads the panel's first target
(
targets[0].expr); if the panel has multiple queries, only the first becomes the seed. - The Observer instance URL defaults to
https://use.observer. Self-hosted Observer customers change it on the plugin's Configuration page (see Configure the Observer URL).
Install#
-
Download
use-observer-app-<version>.zipfrom the GitHub releases page. -
Unzip into Grafana's plugins directory. The default path is
/var/lib/grafana/plugins/; check your distribution if you deploy via Docker or Helm. -
Allow the unsigned plugin to load. Either set the environment variable on the Grafana process:
GF_PLUGINS_ALLOW_LOADING_UNSIGNED_PLUGINS=use-observer-appor add the equivalent line to
grafana.ini:[plugins] allow_loading_unsigned_plugins = use-observer-app -
Restart Grafana.
-
Open Administration → Plugins → All, find Observer Import, and click Enable.
Use#
- Open any dashboard that contains a Prometheus panel.
- Click the panel menu (the kebab icon in the panel's top right).
- Click Create Observer metric from this query. A new tab opens
at
https://use.observer/console/import?source=promql&query=…&title=…. - Sign in if Observer prompts. The console redirects to the metric creation form pre-filled with the panel title and PromQL.
- Pick an agent, set healthy and unhealthy thresholds, and save.
If you belong to more than one Observer organisation and none is active, the import page renders a picker. Pick the organisation to land the metric in; the prefill data carries through.
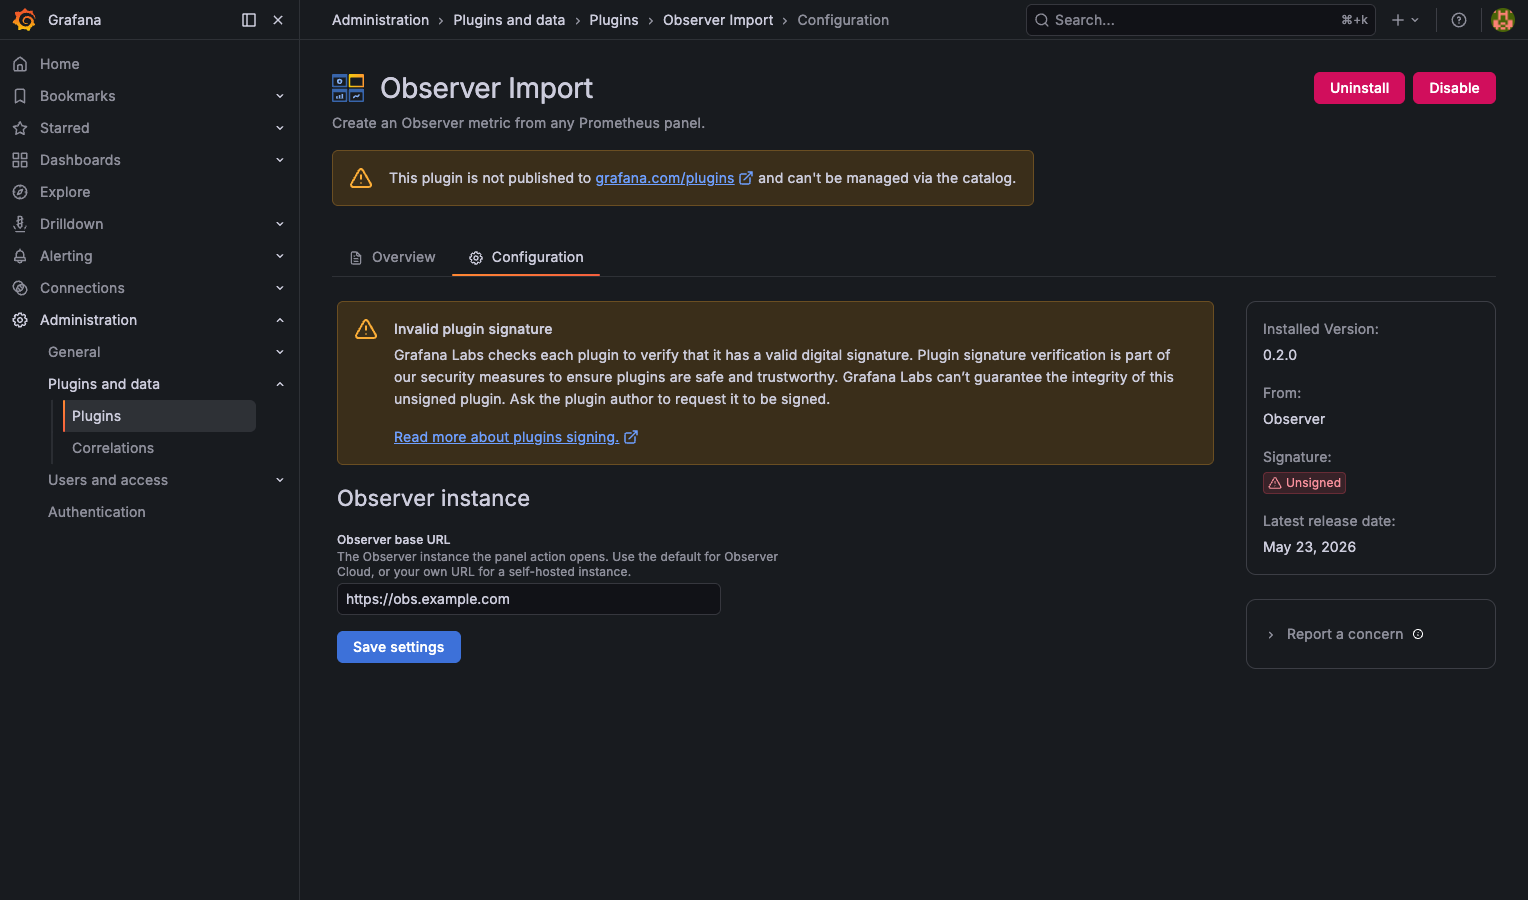
Configure the Observer URL#
By default the action opens https://use.observer (Observer Cloud).
Self-hosted Observer customers point it at their own instance:
- Open Administration → Plugins → Observer Import.
- Open the Configuration tab.
- Set Observer base URL to your instance (for example
https://status.acme.internal). It must be anhttp://orhttps://URL. - Click Save settings. The page reloads and the panel action uses the new URL from then on.
Known limits#
- Prometheus only. Loki, Tempo, CloudWatch, and other data sources do not surface the action. Translating non-PromQL queries to Observer source types is a separate design problem.
- Single query per click. Panels with multiple targets only seed the first. If you want to import all of them, click the action once per panel after switching the target order in Grafana, or create them one at a time in Observer.
- One Observer URL per Grafana instance. The base URL is a single plugin-wide setting, not per-user or per-dashboard. A Grafana serving teams that use different Observer instances can only point at one.
- Panel unit is not propagated. Observer metric definitions do
not have a unit column today; the threshold UI infers units from
the source type. The plugin sends
unit=…for forward compatibility but the form ignores it.
Troubleshooting#
- The action does not appear on a Prometheus panel. Check that the panel's data source type really is Prometheus, not a Prometheus-compatible variant the plugin doesn't recognise. Check that the panel's first target has a non-empty PromQL expression. The action hides itself when either check fails.
- Clicking opens a tab but the Observer form is empty. The prefill validator rejects oversize queries (max 8 KB) and unknown sources. Open the URL bar to see what was sent; trim the query if needed and paste manually.
- Plugin will not enable in Grafana. Confirm the
allow_loading_unsigned_pluginssetting includesuse-observer-app(exact slug, no quotes). Check Grafana's server log for plugin-load errors at startup.